Protein language models through the logit lens
May 21, 2025
The logit lens is a powerful tool for interpreting LLMs. Can we use it to better understand protein language models?
The logit lens
Protein language models like ESM-2 are trained with the masked token prediction task. Given a protein sequence:
What is the amino acid at the masked position?
ESM answers this question with 20 numbers (logits), one for each possible amino acid. Each logit indicates ESM's confidence level in that amino acid being the masked one. To make a prediction, we pick the amino acid with the highest logit.
Here's the idea: logits can be calculated for not only the last layer (ESM's final answers), but also intermediate layers. Intermediate logits give a view into the model's information flow, and in some sense, its "thought process".
ESM through the logit lens
Beta-lactamase
I took a beta-lactamase sequence, masked each position one at a time, and calculated the logits across each layer of ESM-2 (650M).
Each cell below shows the amino acid that ESM is most confident in, colored by its logit value (scroll right for more positions, mouseover for logit values). The true amino acid sequence is shown at the bottom, where the ones that don't match ESM's final prediction are red.
- Logits in earlier layers tend to be uncalibrated. As we move through the layers, ESM often converges on the right answer, though not always.
- By logit values, ESM clearly believes in some positions more than others. For example, it's super confident in position 45 being S––and it's right! As it turns out, the S at position 45 constitutes a binding site, which means that it is likely highly conserved.
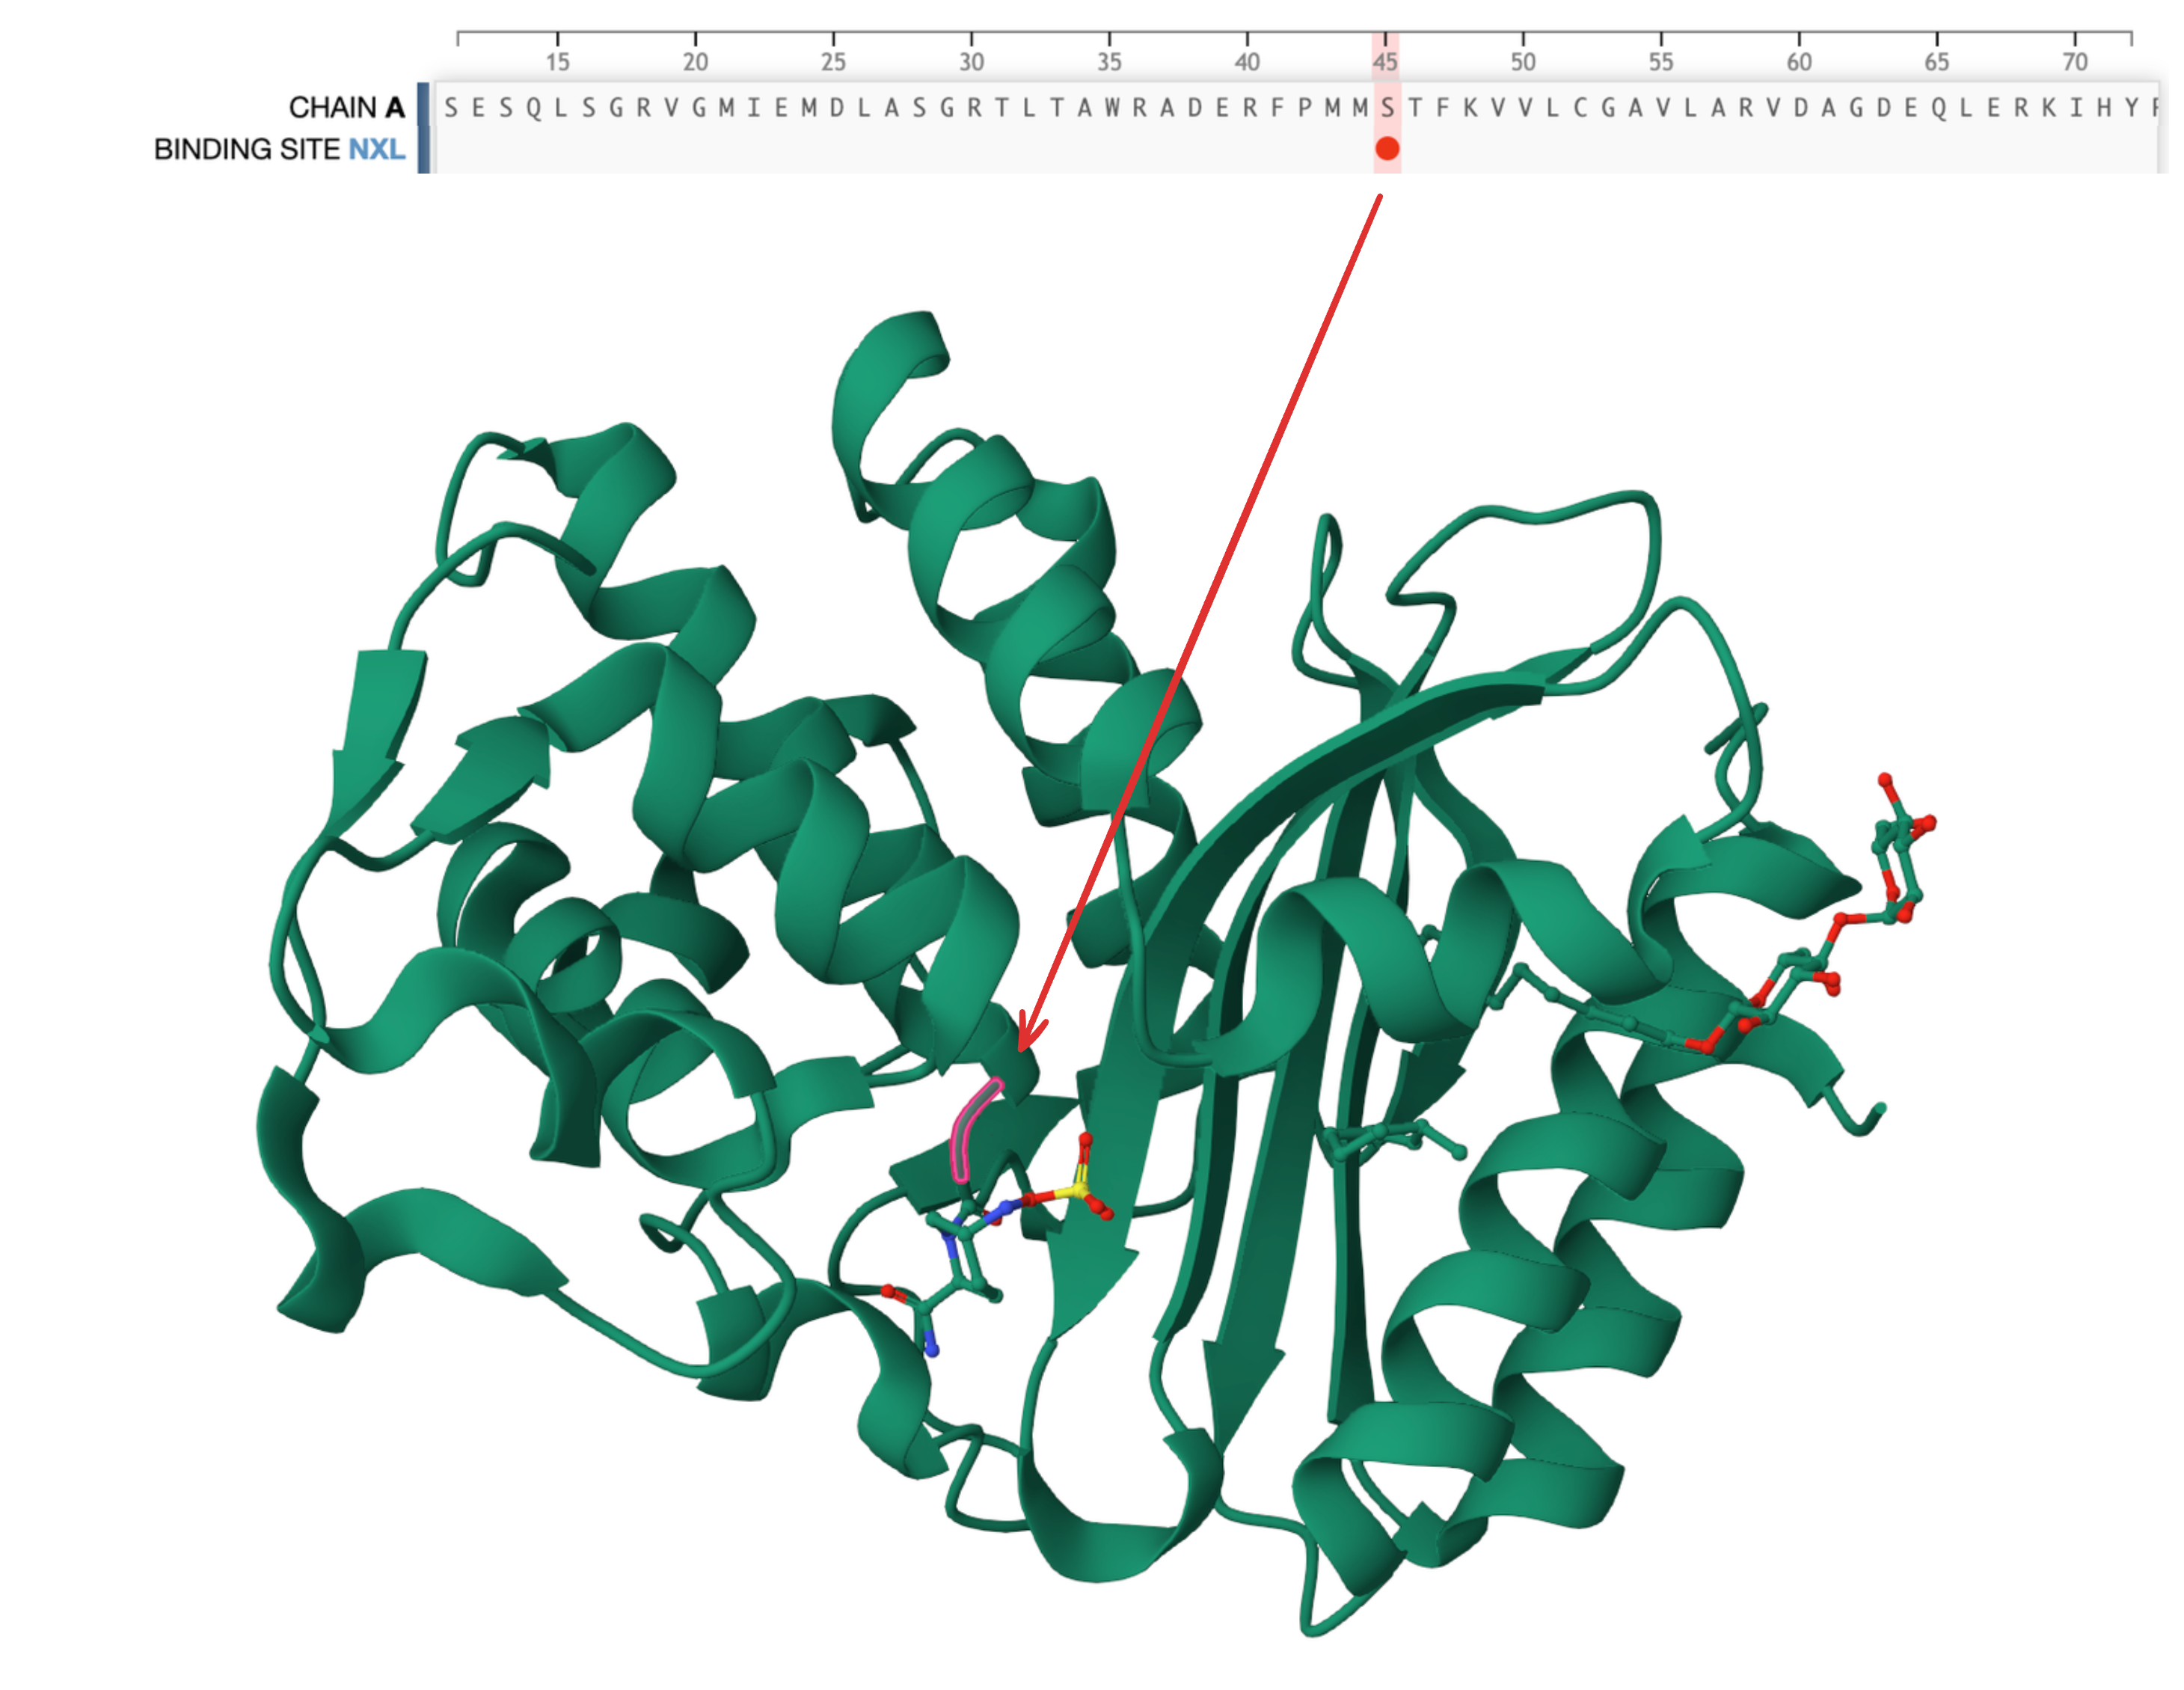
Beta-lactamse (PDB 4ZAM) has a binding site annotation at position 45. We can see on the right that this position contacts the ligand and is therefore likely highly conserved.
- Similarly, ESM also believes strongly––and correctly––in the D at position 106, another binding site. You can explore more annotations at https://www.rcsb.org/3d-sequence/4ZAM?asymId=A.
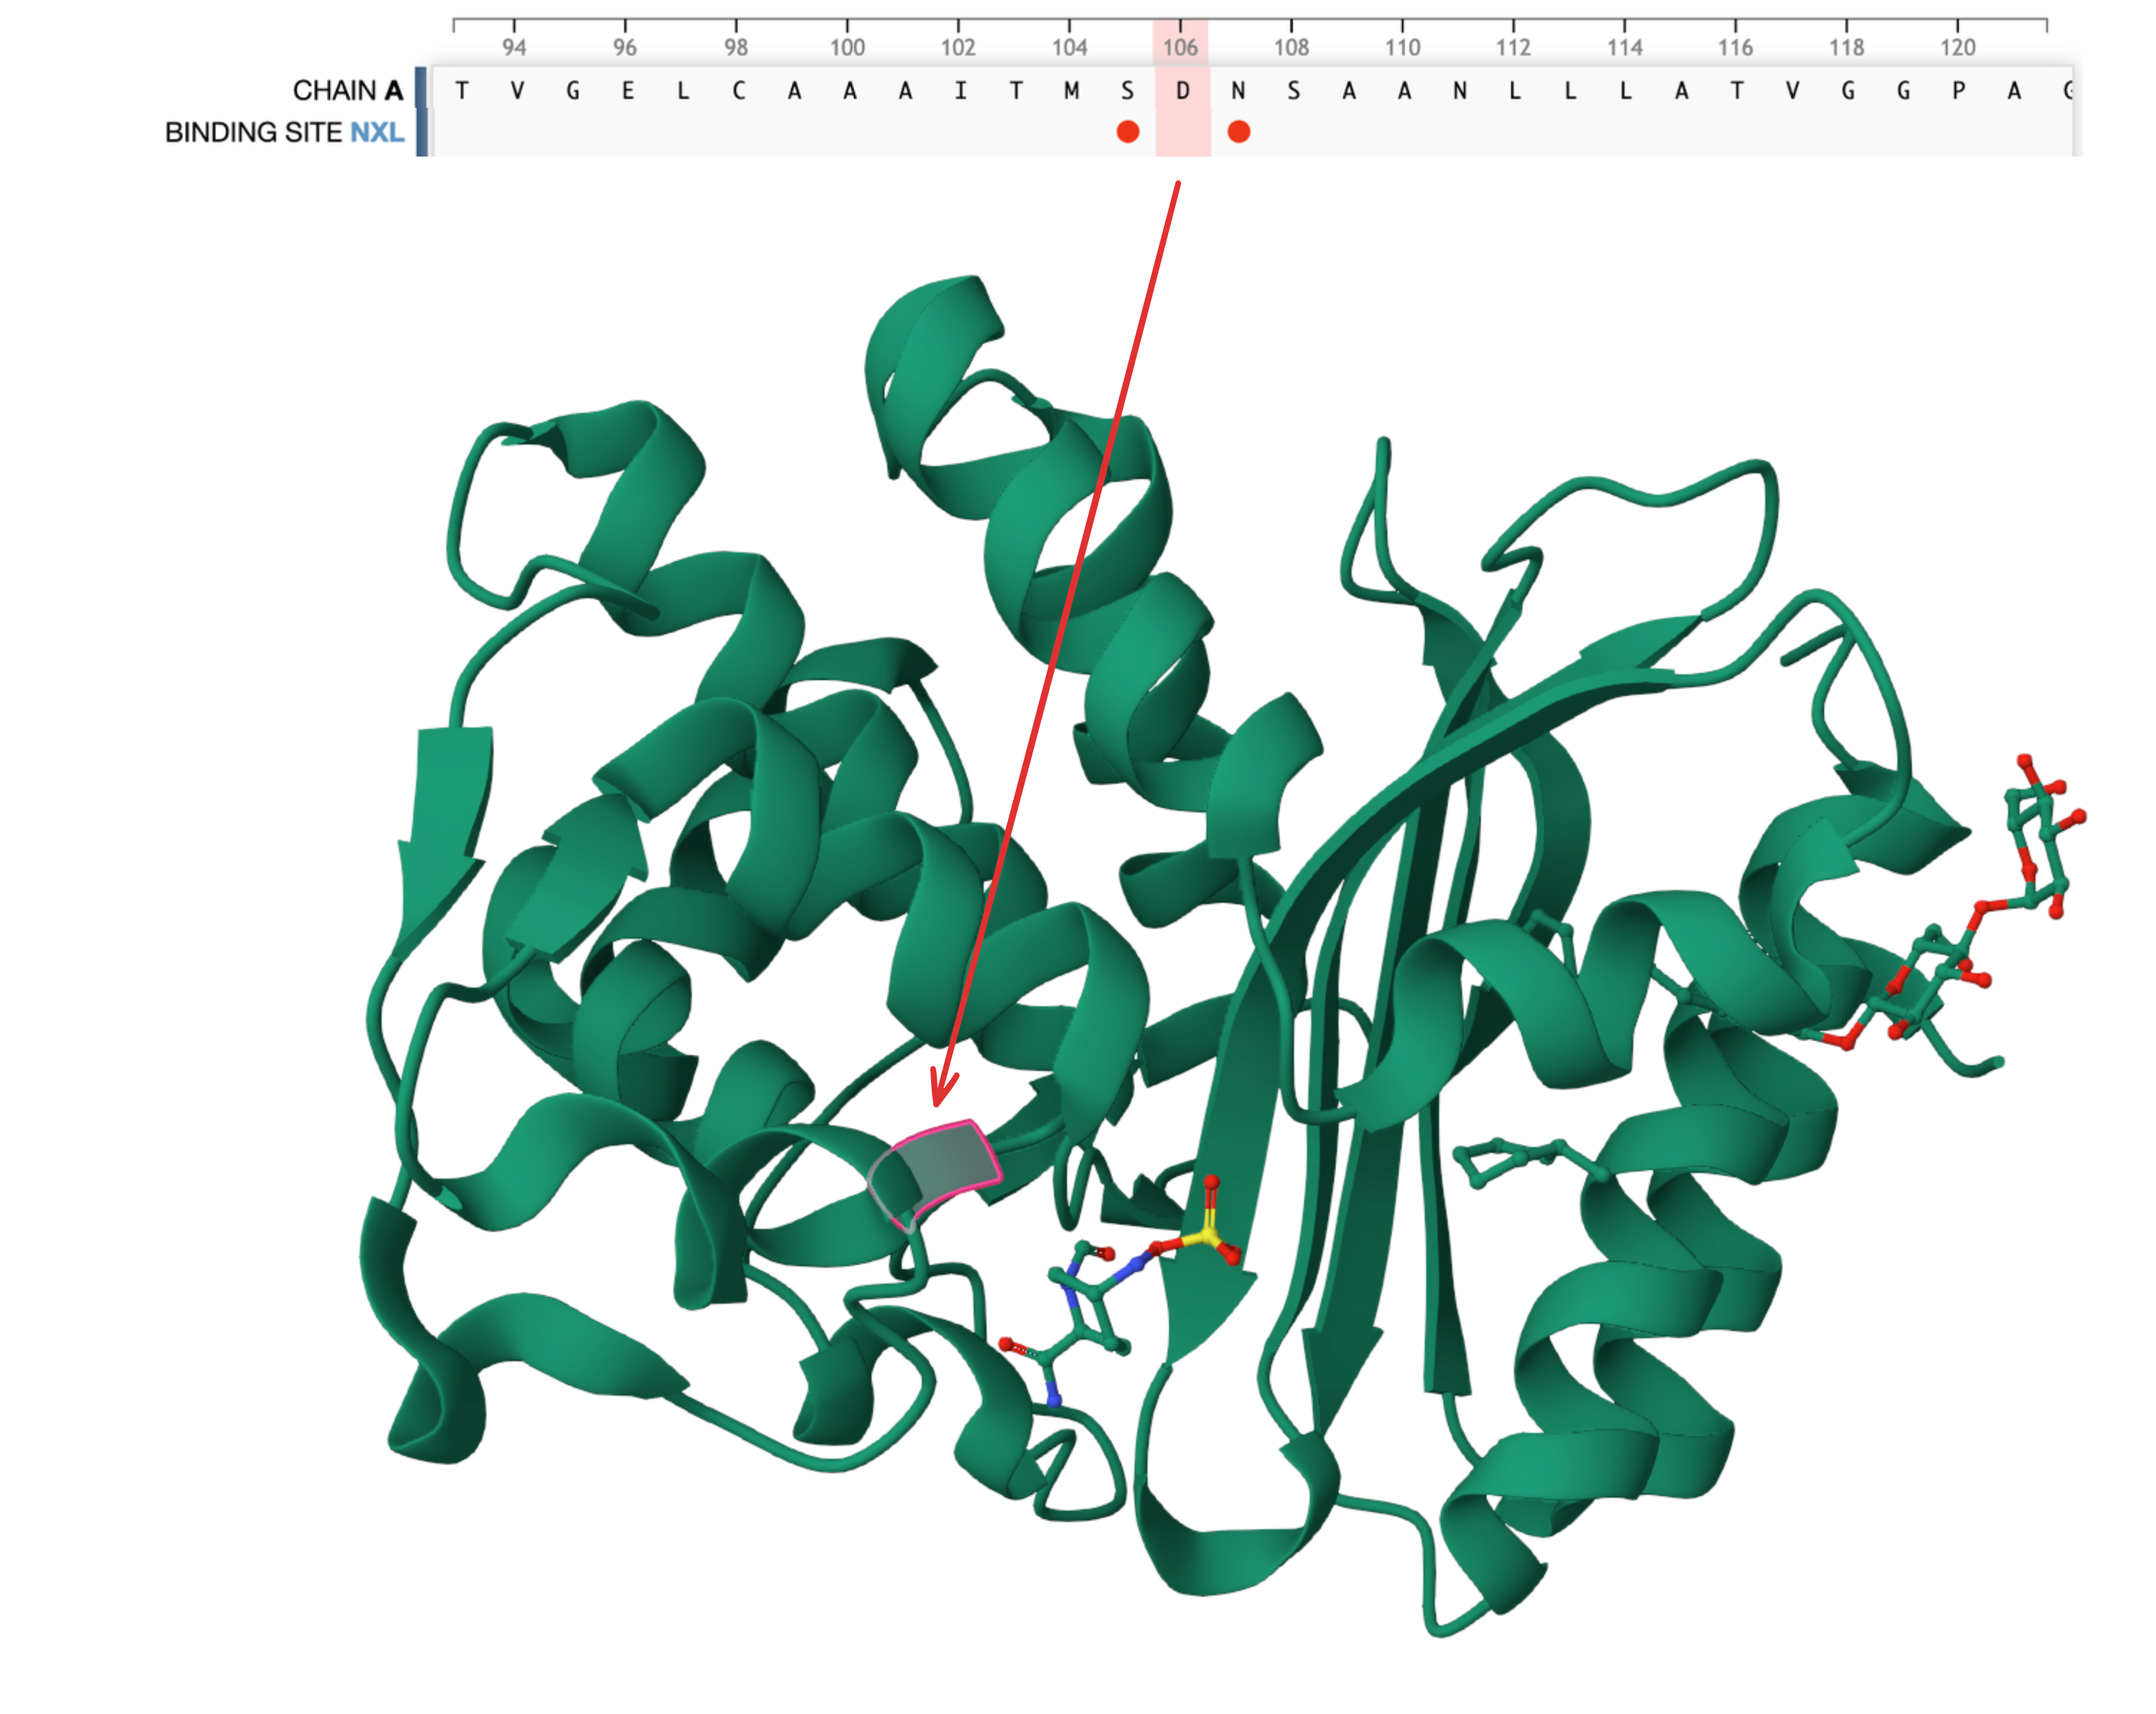
Beta-lactamse (PDB 4ZAM) has another binding site annotation at position 106.
-
At the first position, ESM is wrong but made a reasonable guess: Methionine (M) is often the first amino acid in a protein because it is coded by the start codon.
-
Sometimes, ESM starts believing in an amino acid in an early layer (e.g. position 29 starting from layer 14). Sometimes, it "changes its mind" at the last layer (position 15).
Here's a visualization of the top logit values at each position overlaid on the protein's structure. Use the slider to adjust the layer.
Of course, focusing on the top amino acid is limiting. What about the other amino acids? If ESM got the final prediction wrong, did it come close by at least assigning the true amino acid one of the highest logits? We can visualize that by plotting the rank of the true amino acid among the 20 options.
In many cases where ESM made the wrong prediction, the correct amino acid was quite highly ranked. It got so close! For example, at position 5, the correct amino acid corresponds to ESM's second highest logit.
Antibody
I repeated this for an antibody heavy chain sequence.
I noticed ESM's high conviction on positions 22 and 96 being C. They form a disulfide bridge, important for structural stability. Interestingly, ESM started developing this conviction for both positions simultaneously around layer 10.
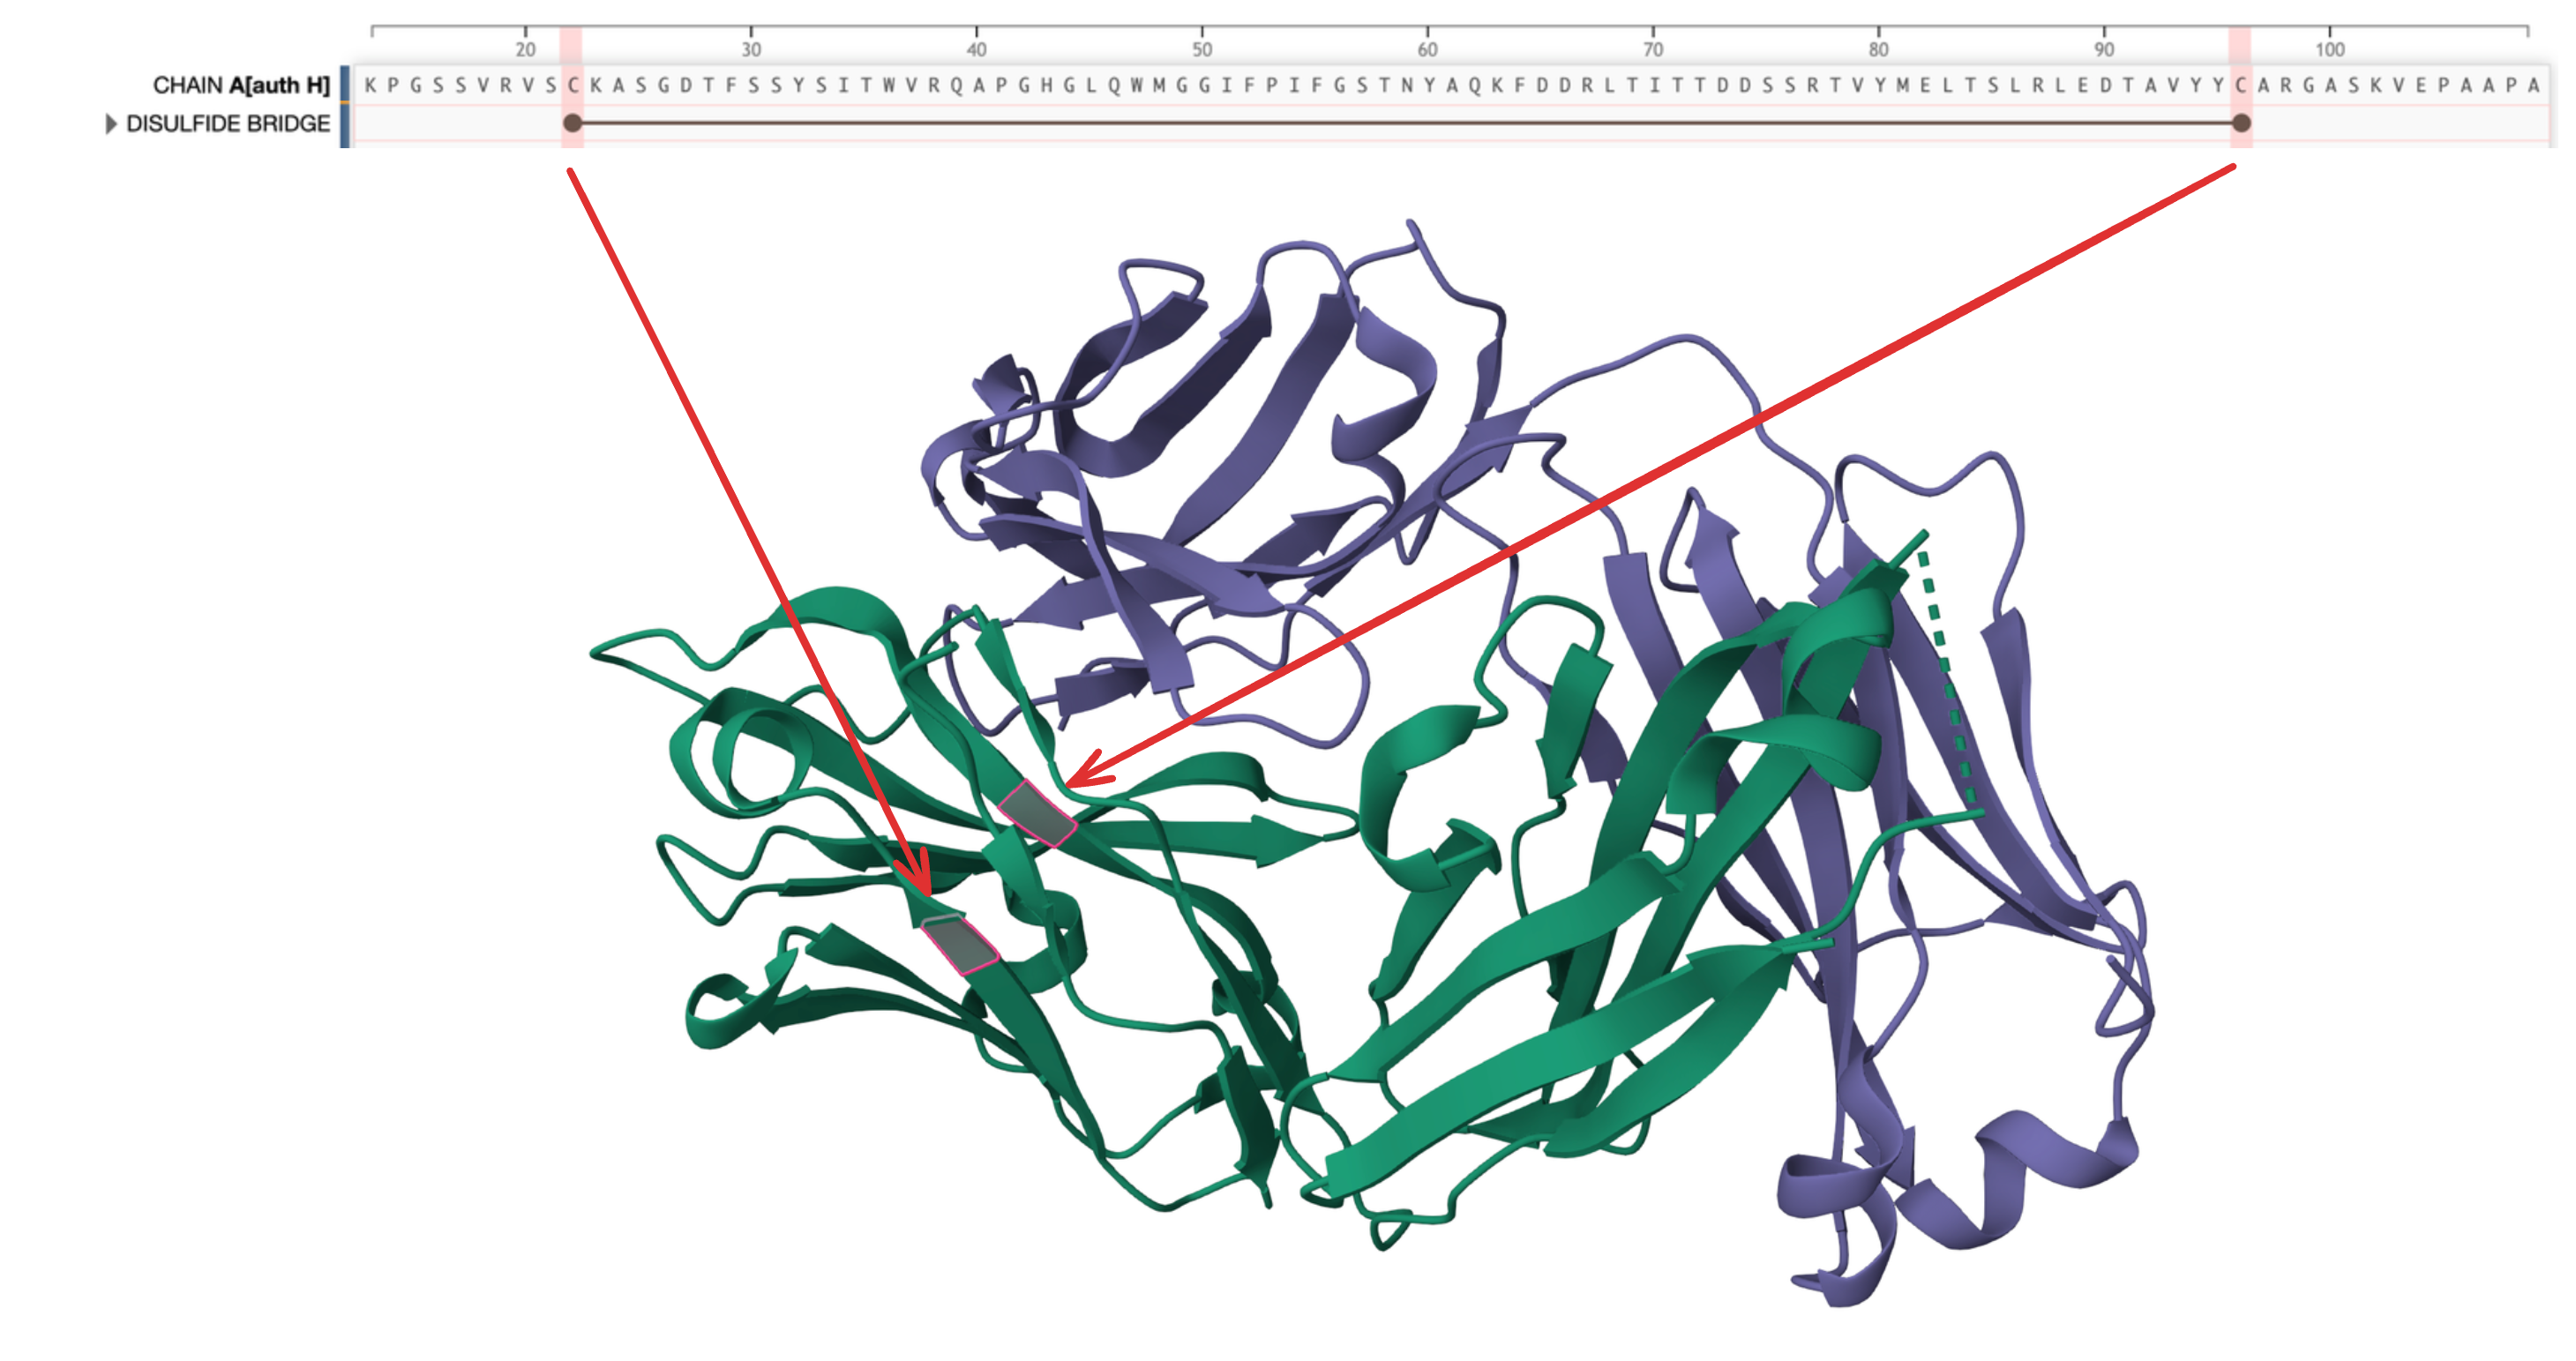
PDB 5XRQ has a disulfide bridge across positions 22 and 96.
There is another disulfide bridge spanning positions 154 - 210. ESM seems to have noticed this one starting from layer 9.
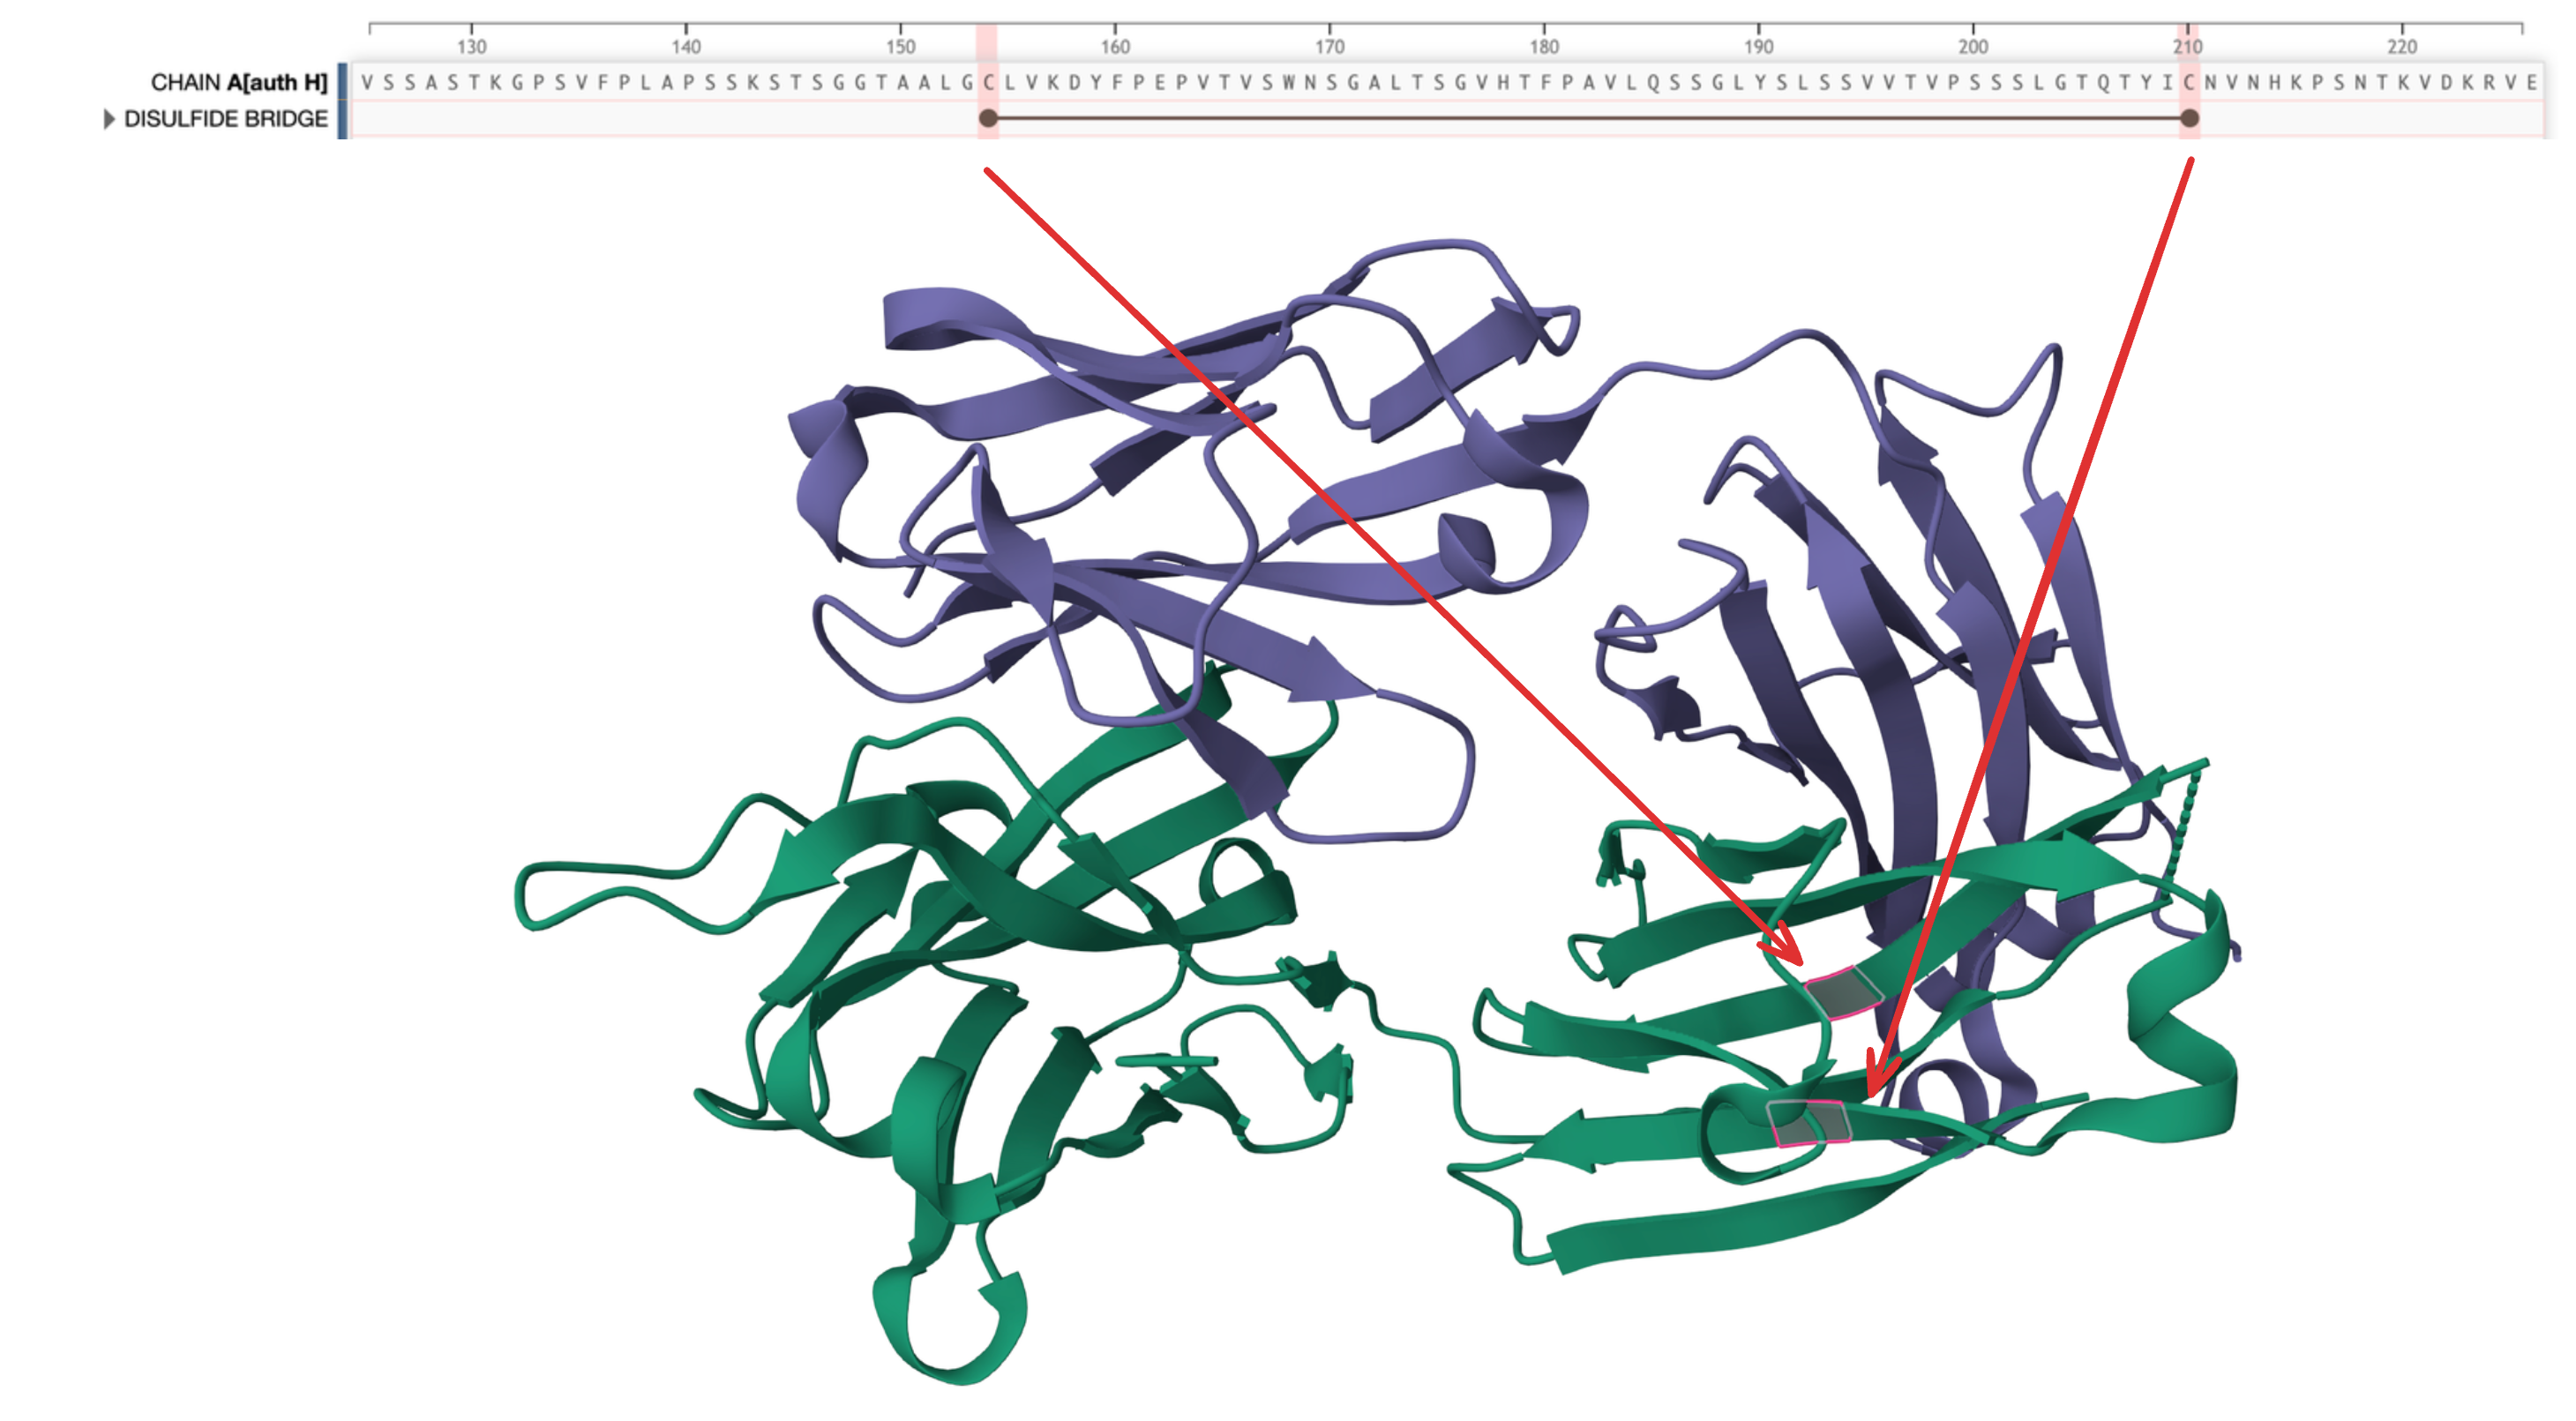
(PDB 5XRQ) has another disulfide bridge across positions 154 and 210.
Here is the structure colored by logits (the other chain is in grey).
And the true amino acid ranks:
Attention maps
In transformers, attention maps capture relationships between sequence positions. Can we visualize them to explain what we saw in the logit lens?
From layer 9, ESM began noticing the disulfide bridge at positions 154 - 210 in the antibody sequence. What are the attention heads doing at that layer? Below are max-pooled attention maps zoomed in at those positions, comparing layer 8 vs. 9.
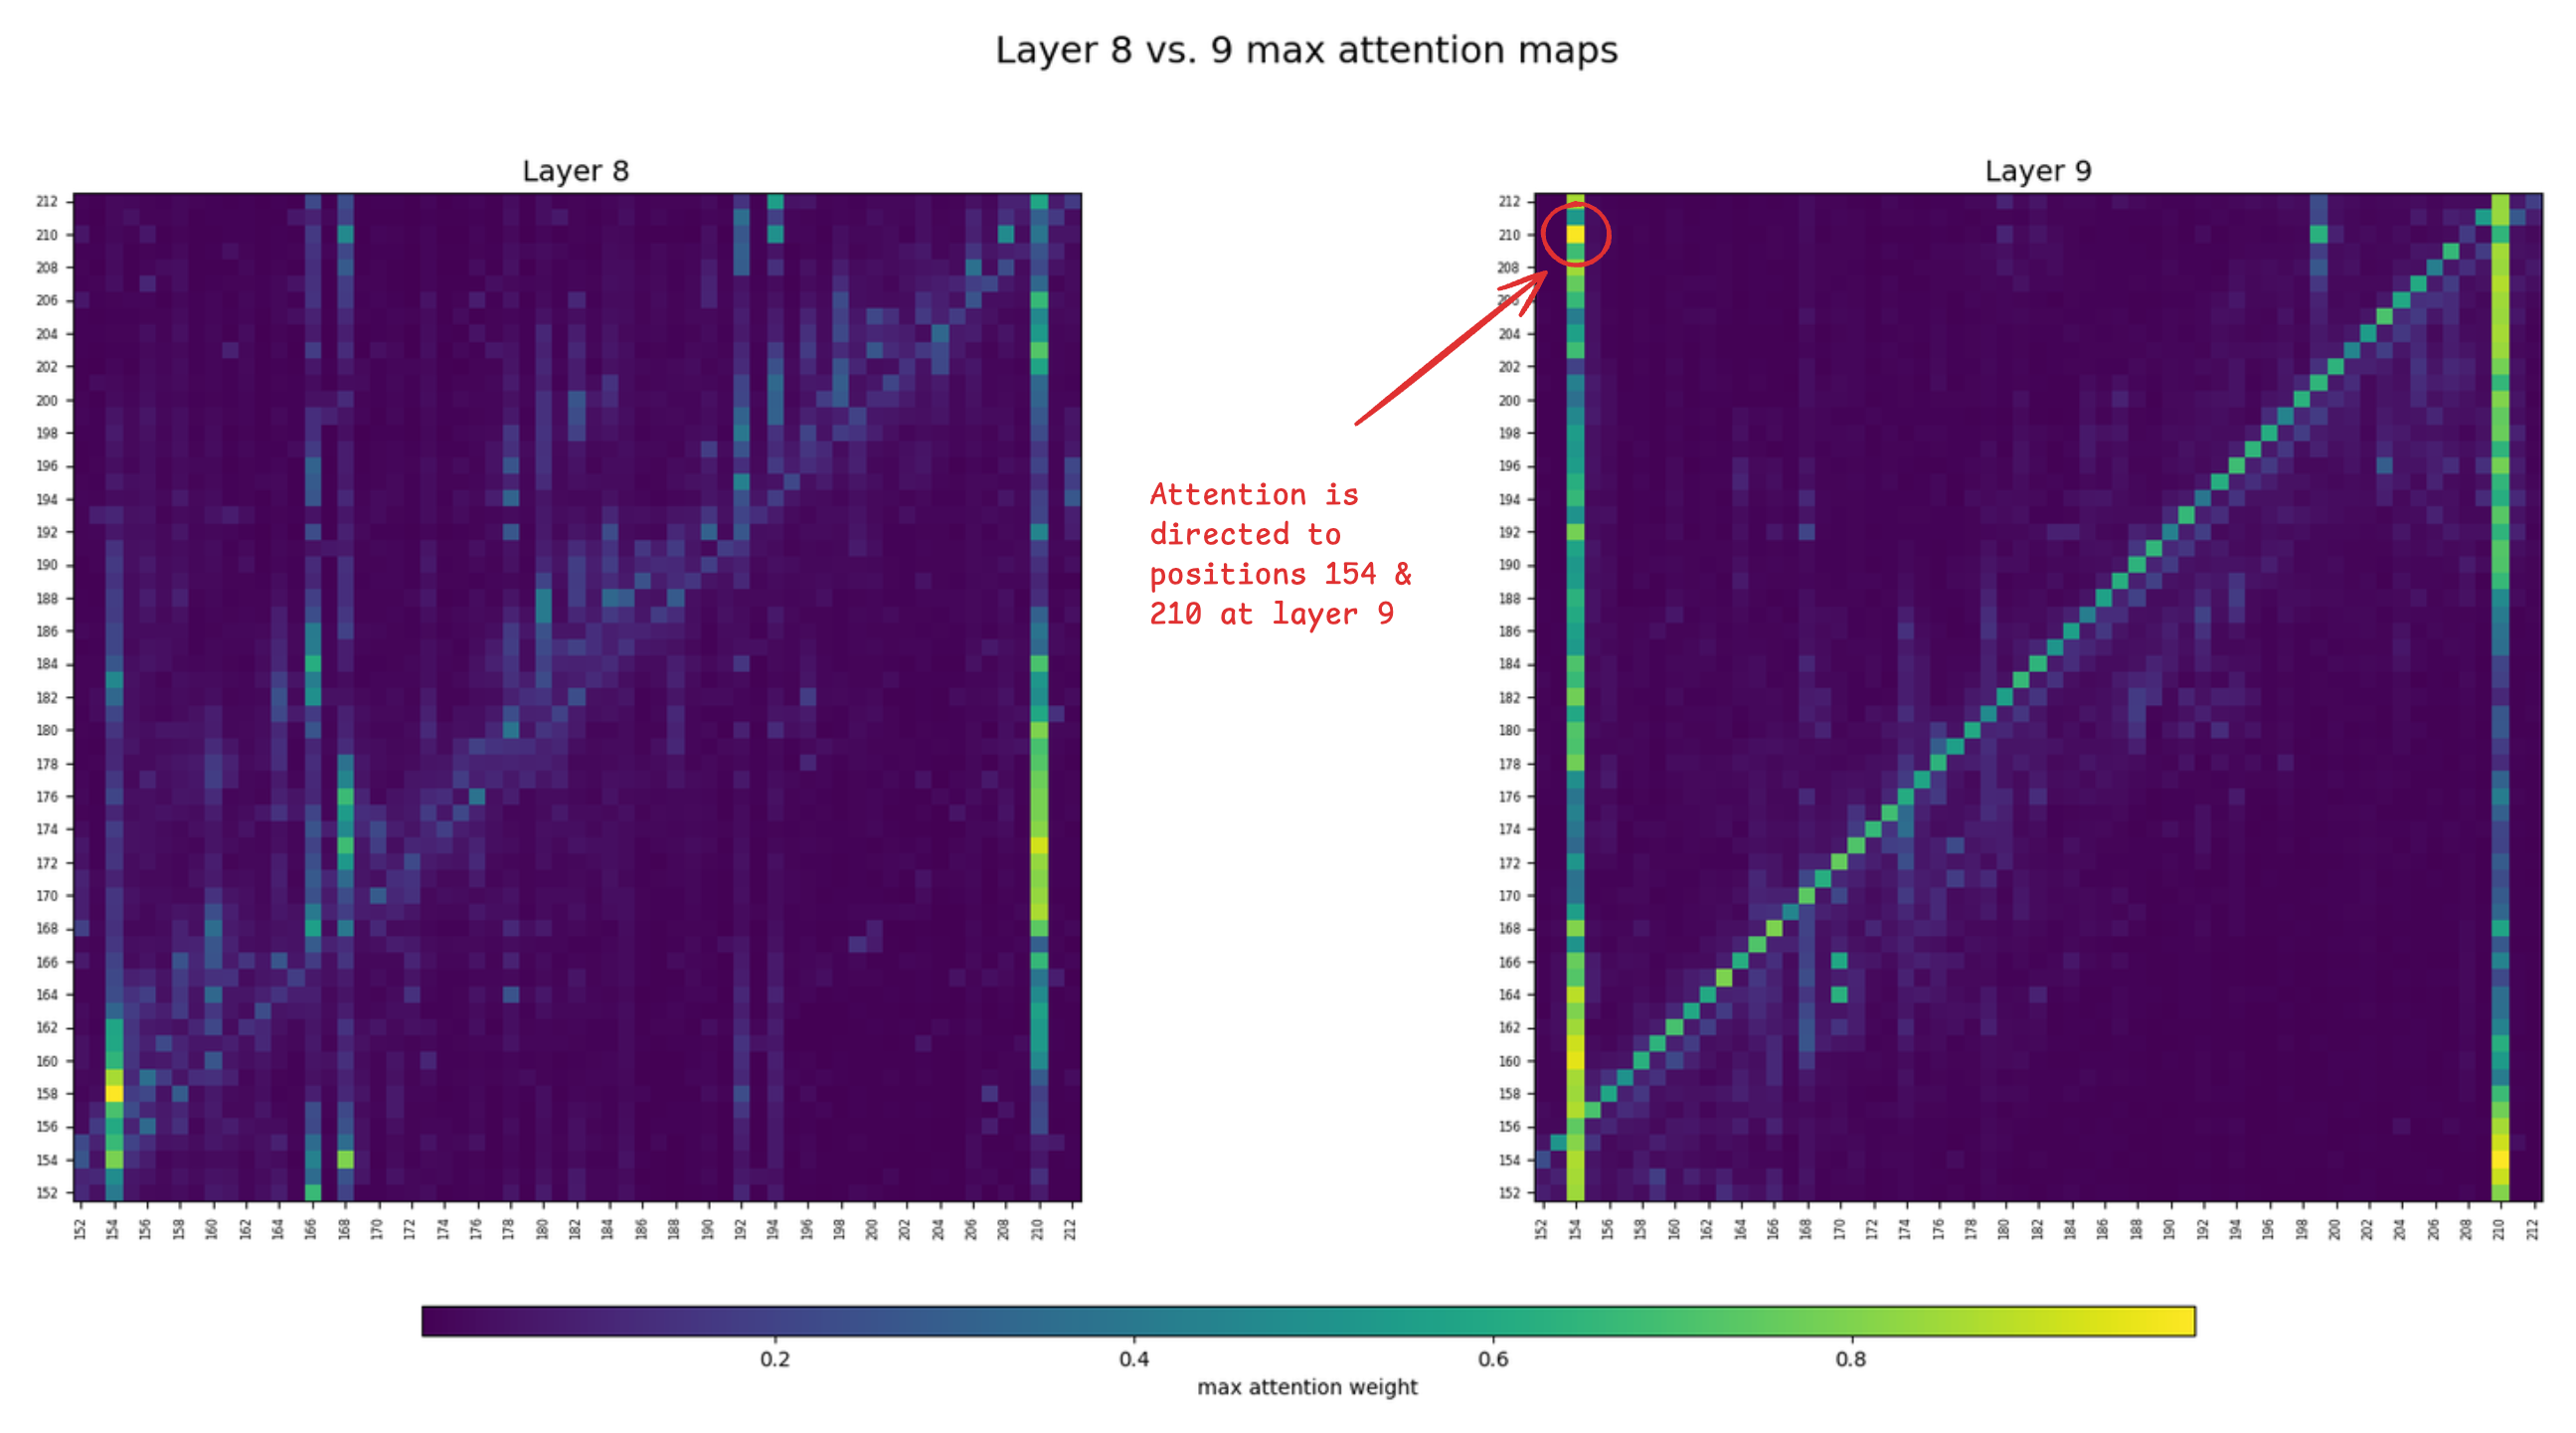
At least one of the attention heads in layer 9 is attending to the positions of the disulfide bridge, which doesn't seem to be the case for layer 8. This might explain why ESM started "seeing" the bridge at layer 9.
Final thoughts
We have quite a few tools in our toolbox now for interpreting protein language models: attention maps, SAEs (plug for our work), and the logit lens. I'm particularly excited about ways we might combine them to gain deeper, systematic understanding of how these models work and answer practical questions:
- Can we design better models that more accurately represent biology and avoid common failure modes?
- Assuming protein models encode some knowledge of biology unknown to us, can we use these tools to extract that knowledge?
Compared to LLMs, interpreting protein models is less intuitive because we didn't invent the language of life (and actually barely understand it). But we've got help in some other ways, like powerful maps of evolution and beautiful structures. The hidden structures in biological models are quite different––and arguably even more exotic and exhilarating.
Acknowledgements
Thank you to Etowah Adams, Minji Lee, Malhar Bhide, and Yash Rathod for reading a draft of this post and giving feedback and ideas.